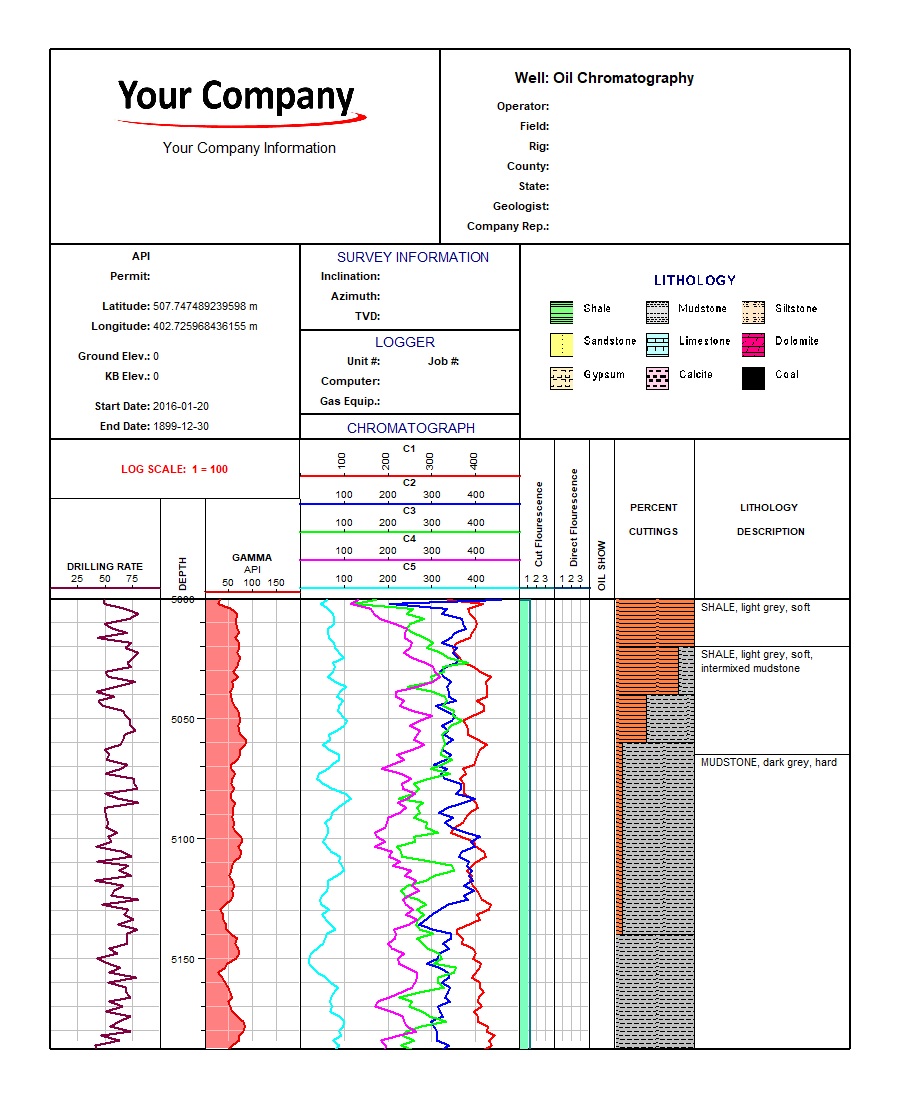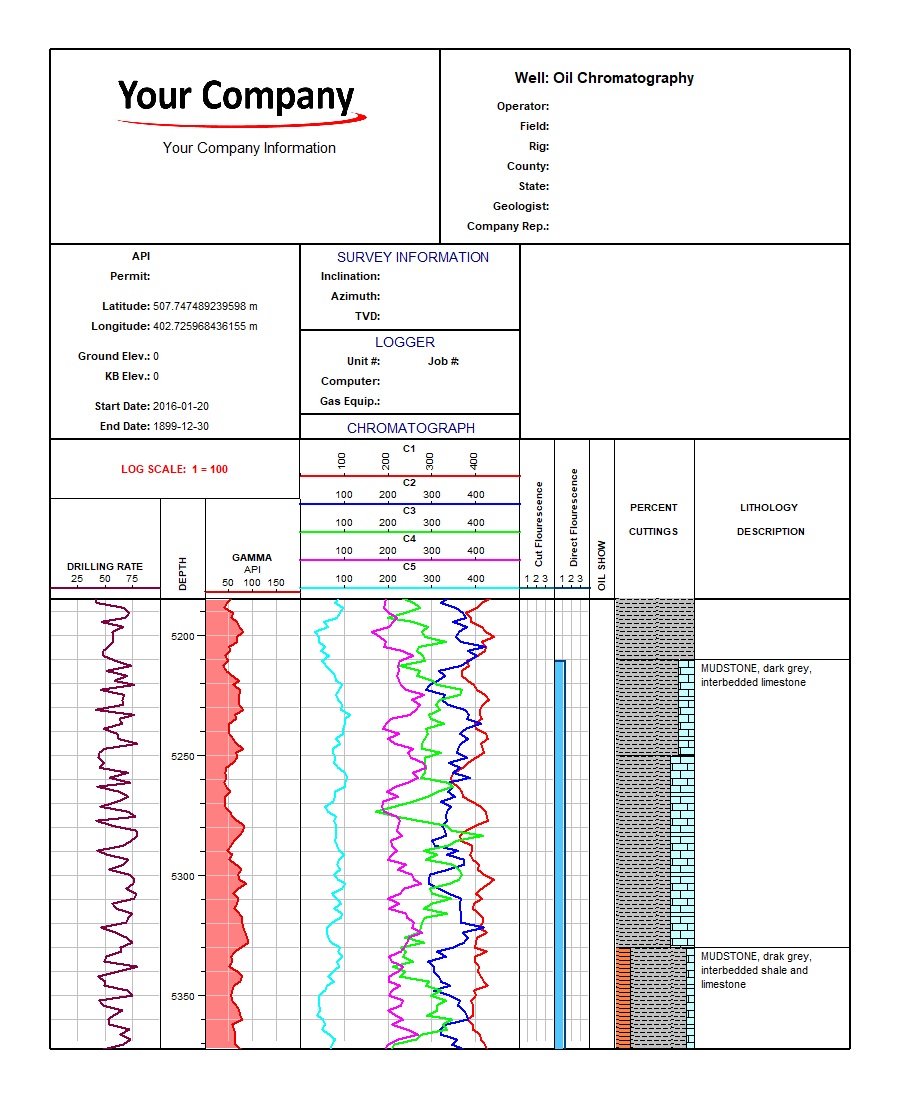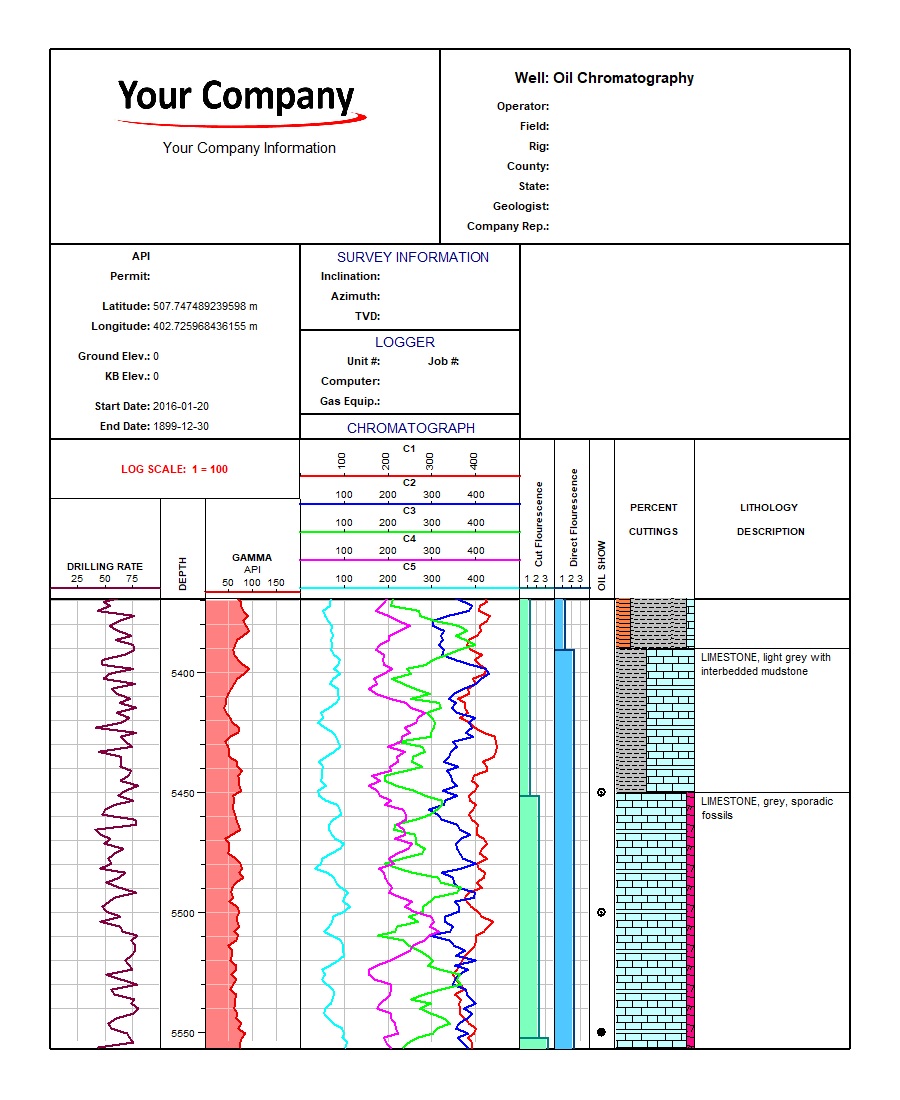

This example demonstrates a petroleum well log covering the 5,000–6,000 ft interval. Five chromatograph curves—C1 through C5—are presented beside drilling rate, gamma API, cuttings fluorescence, direct fluorescence, oil-show symbols, percent cuttings and detailed lithologic descriptions.
The record contains 501 samples for each continuous curve, 12 lithology intervals, 16 cuttings intervals and nine oil-show records. Automated validation passes the example with 100% completeness, Good quality, 85% confidence, and no errors or warnings.
The combined display allows changes in light hydrocarbon components to be compared directly with gamma response, drilling behaviour, fluorescence, oil shows and cuttings composition. This makes the example useful for illustrating how multiple mud-logging datasets can be synchronized within one professional well-log presentation.
The supplied validation report records Passed status, 100% completeness, Good quality, an 85% confidence score, and zero errors and zero warnings.
Download the example files individually. The XML template and log can be imported into WinLoG Version 6 and customized for company-specific mud-logging workflows.
Demonstrates how gas components, gamma response, lithology and shows can be interpreted together through a well interval.
Shows chromatograph curves beside drilling rate, fluorescence, oil shows, percent cuttings and field descriptions.
Provides a reusable starting point for gas curves, geophysical tracks, lithology legends, company headers and validation requirements.
WinLoG templates can be customized for company standards, regional lithology, chromatograph components, curve scales, cuttings classifications, fluorescence records and organization-specific validation requirements.
Contact GAEA Technologies
GAEA Technologies develops and distributes geoscience and engineering solutions worldwide. Our solutions have been used for over 30 years by companies and organizations around the world.
© 2026 - All Rights Reserved