
WinLoG Oil Total Gas Example

2-sheet log Validation Passed
OIL & GAS TOTAL GAS EXAMPLE

WinLoG Oil Total Gas Example

A petroleum mud-log presentation combining total gas, drilling rate, cuttings composition, lithology and formation tops.

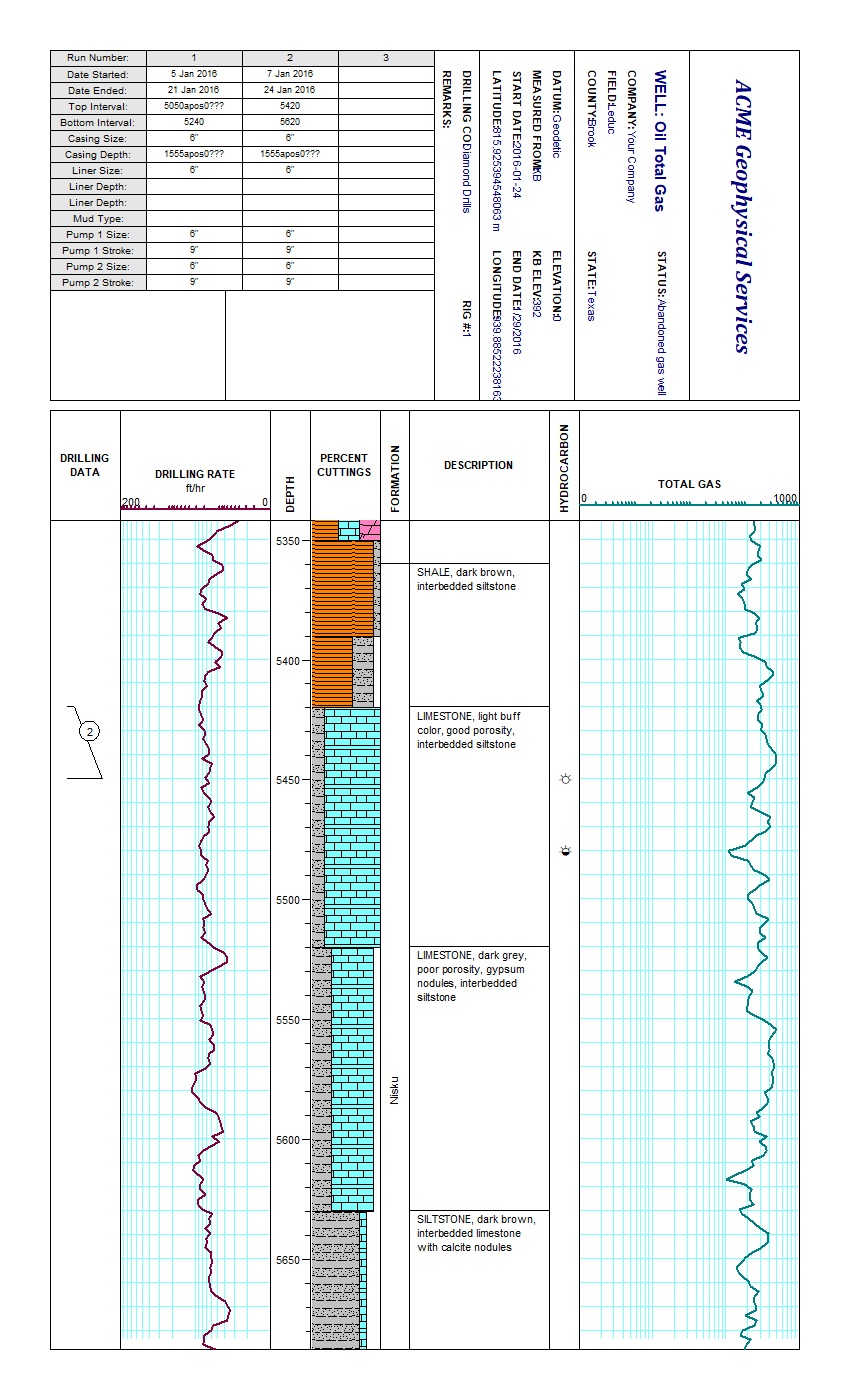
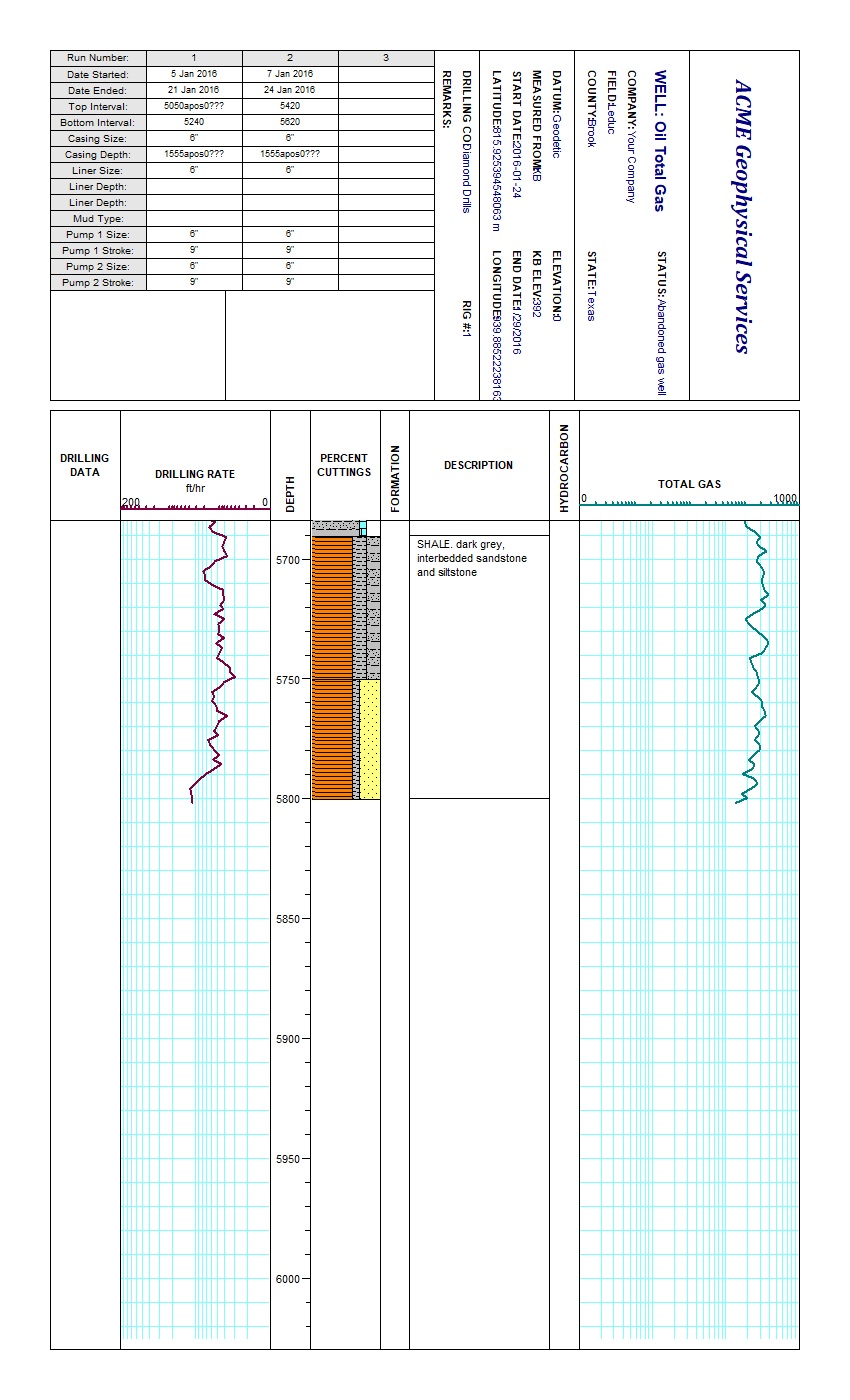
This example shows how WinLoG organizes an oil and gas well record across the 5,000–5,800 ft logged interval. The Oil Total Gas well combines continuous total-gas and drilling-rate curves with percent cuttings, lithologic descriptions, formation markers, hydrocarbon observations and drilling information.

The record contains 401 depth samples for each continuous curve, 13 cuttings-composition intervals and four formation tops. Automated validation passes the example with 100% completeness, Good quality, 85% confidence, and no errors or warnings.

Oil & GasTotal GasDrilling RatePercent CuttingsFormation TopsValidation PassedXML Template

Download Complete Example Back to Example Library

Capabilities Demonstrated

What This Total Gas Example Shows

Continuous Curves

  • Total gas from 0 to 1,000
  • Drilling rate in ft/hr
  • 401 values per curve
  • Two-foot sampling interval
  • Depth-aligned comparison
  • Grid-based curve display

Geological Logging

  • Ten lithology intervals
  • Shale, limestone and siltstone
  • Patterned lithology column
  • Plain-language descriptions
  • Porosity observations
  • Interbedded units

Cuttings & Drilling

  • 13 percent-cuttings intervals
  • Multi-component composition
  • Drilling-run information
  • Casing and pump fields
  • Drilling event symbols
  • Hydrocarbon observations

Validation

  • Validation passed
  • 100% completeness
  • Good data quality
  • 85% confidence
  • No errors or warnings
  • Validation reporting

A Clean Petroleum Mud-Log Example

This record demonstrates a conventional oil and gas logging workflow without deliberate validation exceptions. Continuous curves, formation markers, lithologic intervals, cuttings percentages and drilling records are displayed together so changes in gas response can be compared with drilling and geological conditions.

The supplied validation report records Passed status, 100% completeness, Good quality, an 85% confidence score, and zero errors and zero warnings.

Example Data

Key Information Demonstrated

Formations and Lithology

  • Turner Valley top at 5,000 ft
  • Leduc top at 5,090 ft
  • Kisku top at 5,220 ft
  • Nisku top at 5,360 ft
  • Ten described lithology intervals
  • Logged interval terminates at 5,800 ft

Curves and Cuttings

  • Total gas and drilling rate sampled every 2 ft
  • 401 values in each continuous dataset
  • Percent cuttings across 13 intervals
  • Composition displayed as proportional patterns
  • Hydrocarbon-show symbols by depth
  • Two drilling runs summarized in the header
Log Preview

Review Both Sheets of the Total Gas Log

Oil Total Gas log sheet 1 preview View Sheet 1
Sheet 1 - Drilling, cuttings, lithology and total gas
Oil Total Gas log sheet 2 preview View Sheet 2
Sheet 2 - Lower logged interval to 5,800 ft

Download the Complete Example

Download the example files individually. The XML template and log can be imported into WinLoG Version 6 and customized for petroleum logging workflows.

Included in the Example

  • Professional two-sheet petroleum log
  • Clean validation report
  • Reusable total-gas and cuttings template
  • Complete XML well data
  • Continuous drilling-rate and total-gas datasets
Applications

Who This Example Is For

Petroleum Geologists

Demonstrates comparison of lithology, formation tops, cuttings composition and total-gas response through a logged well interval.

Mud-Logging Teams

Shows continuous drilling and gas curves beside cuttings descriptions, drilling events and hydrocarbon observations.

Template Designers

Provides a reusable starting point for company headers, drilling fields, proportional cuttings, curve tracks and validation requirements.

Related Examples

Continue Exploring WinLoG

Customize This Total Gas Example

WinLoG templates can be customized for company standards, regional stratigraphy, mud-logging programs, curve scales, cuttings classifications and organization-specific validation requirements.

Contact GAEA Technologies