
WinLoG Oil Sands Example

Oil sands borehole log sheet 1 View Full Log
Oil Sands Borehole Log
2-page log Validation Passed
OIL SANDS EXPLORATION AND CHARACTERIZATION EXAMPLE

WinLoG Oil Sands Example

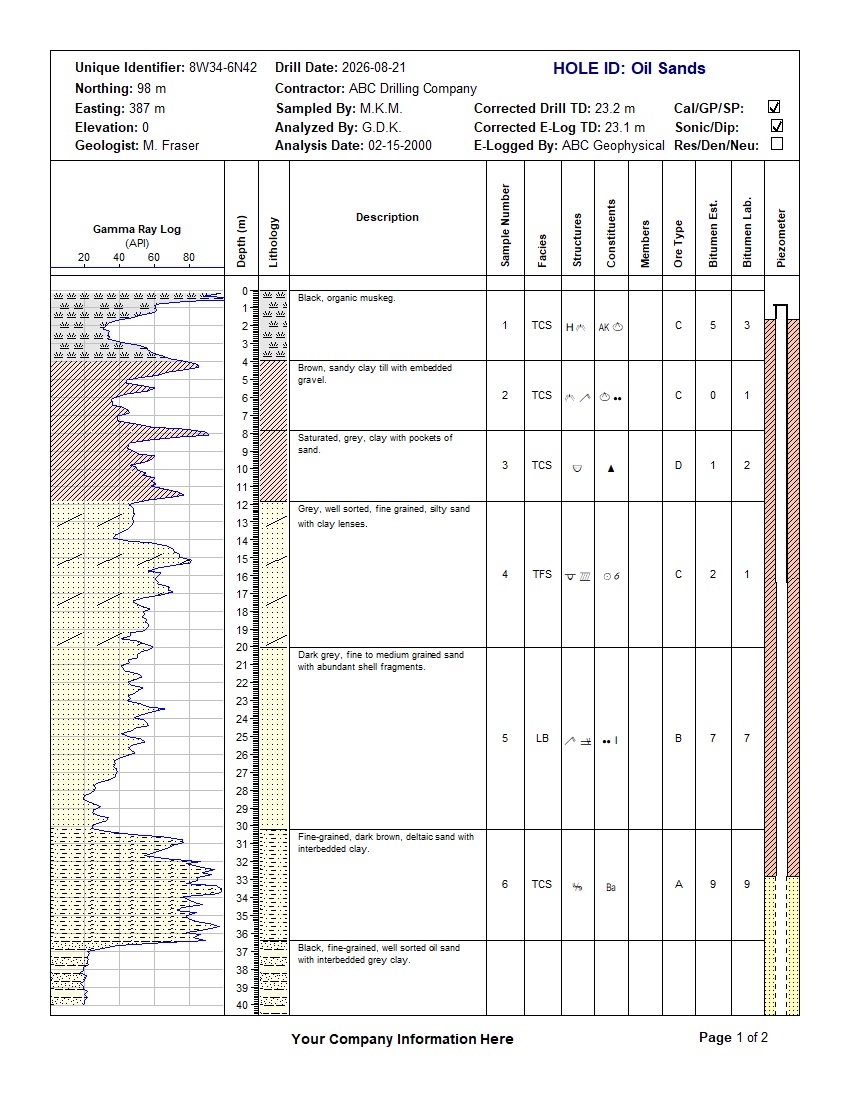
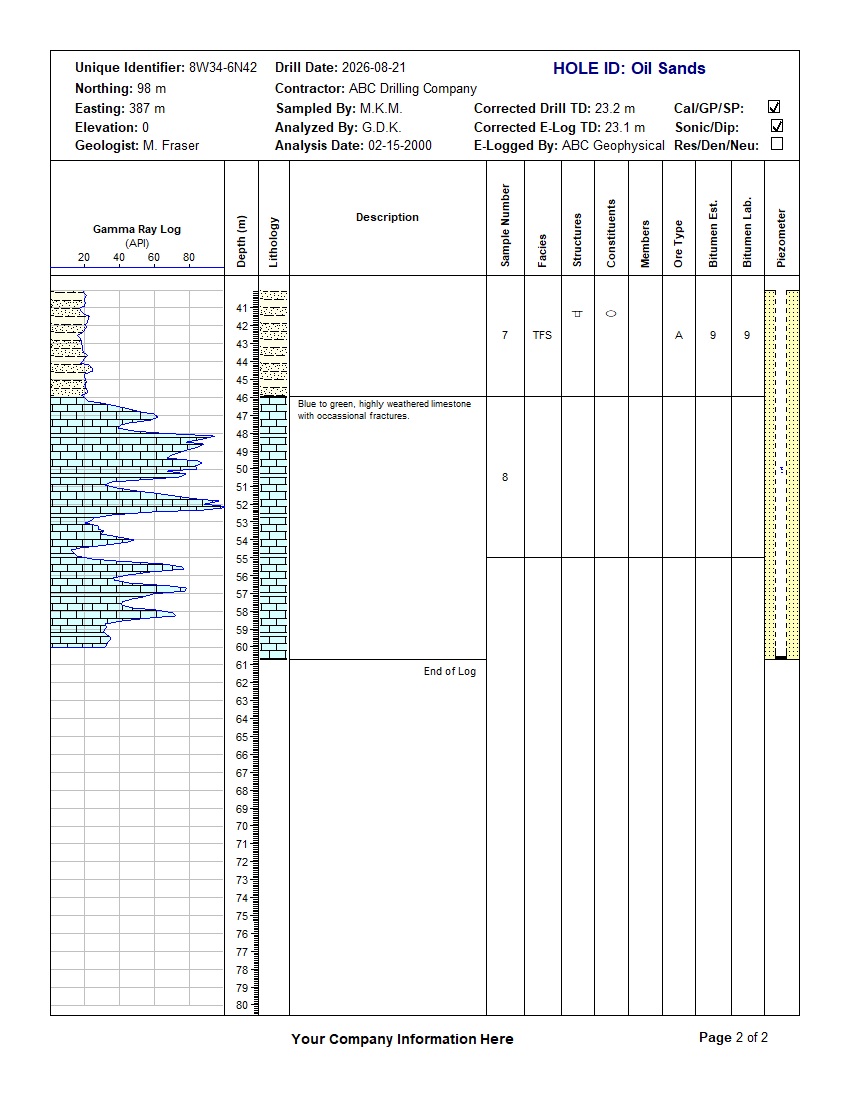
Integrated gamma ray, lithology, samples, geological descriptors, bitumen results and piezometer construction in a two-page log.

This example demonstrates a 60.7 m oil-sands borehole extending from organic muskeg and glacial deposits through sand, deltaic sand and oil sand into weathered limestone. Gamma-ray response is plotted beside the lithology and descriptions for direct depth-based interpretation.

The record contains eight lithology intervals, seven samples, four oil-staining intervals, six descriptive interval datasets and a six-component piezometer/well construction. Automated validation passed with 100% completeness, Good quality, 85% confidence, and no errors or warnings.

Oil SandsGamma RayLithologyFaciesOil StainingBitumen ResultsPiezometerValidation Passed

Download Complete Example Back to Example Library

Capabilities Demonstrated

What This Oil Sands Example Shows

Gamma Ray

  • Continuous API curve
  • Depth-aligned curve fill
  • Lithology correlation
  • 0 to 60.7 m coverage
  • Two-page presentation

Lithology

  • Eight depth intervals
  • Muskeg and glacial till
  • Clay and silty sand
  • Deltaic sand and oil sand
  • Weathered limestone

Sample Description

  • Seven sample records
  • Facies and structures
  • Constituents and members
  • Ore type
  • Bitumen estimates and lab data

Piezometer

  • Six construction components
  • Casing and screen intervals
  • Seal and packing
  • Bottom seal and cap
  • Water level at 50 m

Validation Results

The validation report records a Passed status with 100% completeness, Good data quality and an 85% confidence score.

No errors or warnings were generated. The result demonstrates a fully populated example in which lithology, sample descriptors, bitumen information, gamma ray and well-construction data remain depth-consistent.

Example Data

Lithology, Descriptors and Construction

Geological Sequence

  • Muskeg: 0 to 3.94 m
  • Sandy clay till: 3.94 to 7.87 m
  • Silty clay: 7.87 to 11.81 m
  • Silty sand and sand: 11.81 to 30.18 m
  • Deltaic sand: 30.18 to 36.42 m
  • Oil sand: 36.42 to 45.93 m
  • Limestone: 45.93 to 60.7 m

Interpretation Tracks

  • Facies classifications
  • Structures and constituents
  • Members and ore types
  • Bitumen field estimates
  • Bitumen laboratory results
  • Four oil-staining intervals
  • Piezometer construction diagram
Log Preview

Review Both Sheets

Oil sands log sheet 1 preview View Sheet 1
Sheet 1 - 0 to 40 m
Oil sands log sheet 2 preview View Sheet 2
Sheet 2 - 40 to 60.7 m
Downloads

Download the Complete Example

Review the finished two-page log and validation report, or load the supplied XML log and template into WinLoG.

Applications

Who Can Use This Example?

Oil Sands Geologists

Demonstrates integrated lithology, gamma ray, facies, oil staining and bitumen characterization across an oil-sands sequence.

Field and Laboratory Teams

Shows sample numbering, field bitumen estimates and laboratory results in a shared depth-based presentation.

Template Designers

Provides a reusable model for combining geological description, analytical data and piezometer construction in one log.

Customize This Oil Sands Example

WinLoG templates can be customized for company standards, curve tracks, lithology libraries, bitumen datasets, sample descriptors, analytical results and piezometer configurations.

Contact GAEA Technologies