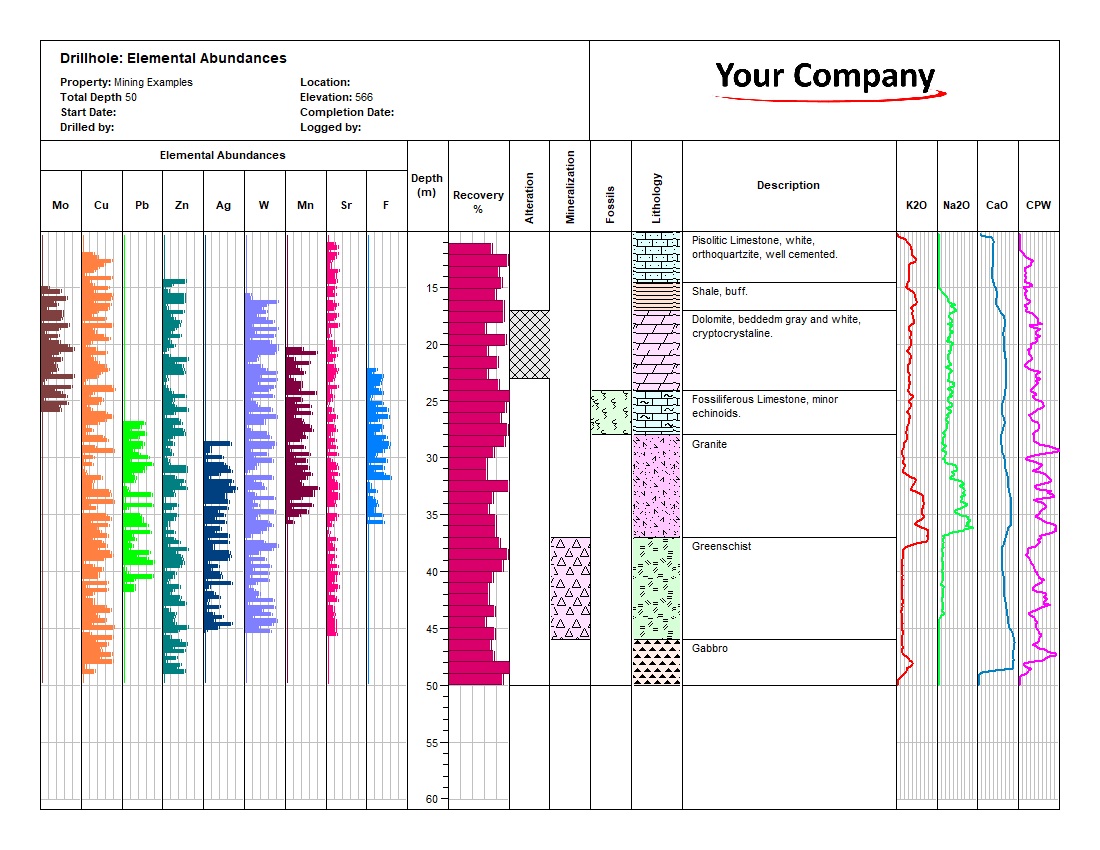

This example presents a 50 m mineral-exploration drillhole using fourteen coordinated graph datasets. It displays the elemental abundance profiles for Mo, Cu, Pb, Zn, Ag, W, Mn, Sr and F, together with recovery and the K2O, Na2O, CaO and CPW curves.
Alteration, mineralization, fossils, lithology symbols and detailed geological descriptions share the same measured-depth scale, allowing geochemical changes to be compared directly with interpreted rock units. Automated validation completed with 100% completeness, 85% confidence, and no errors or warnings.
The example places high-density elemental and mineralogical curves beside recovery, alteration, mineralization, fossils and lithology. This makes changes in geochemical response immediately comparable with geological boundaries and descriptive observations.
The log spans depths from 10 to 50 m and includes pisolitic limestone, shale, dolomite, fossiliferous limestone, granite, greenschist and gabbro. Consistent depth alignment supports rapid visual correlation and review across all datasets.
Review the finished log and validation report, or load the XML log and template into WinLoG.

GAEA Technologies develops and distributes geoscience and engineering solutions worldwide. Our solutions have been used for over 30 years by companies and organizations around the world.
© 2026 - All Rights Reserved