GaeaSynergy
Description
GaeaSynergy is an application suite for geoscientific analyses, mapping, data display and data management. It uses the synergy within the geoscientific data to effectively and efficiently fulfill the needs of several industries. The program can be used to evaluate contaminants, soil and rock properties, mineral deposits, and oil and gas deposits. It is ideal for the environmental, geotechnical, mining, oil sands, and petroleum industries.
Version 5 of GaeaSynergy has just been released. This new version has many new and enchanced features as well as new purchasing and subscription options for the optional modules.
GaeaSynergy is comprised of a base application and several optional modules. The base application is free and is used as a platform that all of the other modules build upon. The base application consists of the following components:
- Database Management
- License Management
- User Management
- Geographic Information System
- Mapping and Gridding
- 3D Display
- Import/Export
Optional Modules
Using the optional modules, the program can be used to generate geotechnical test results and reports, lab analyses reports, boring and well logs, cross-sections, and fence diagrams. The following optional modules are available:
Features
The base application of GaeaSynergy consists of several components that provide functionality to both the base application and optional modules. These components are the database management, license management, user management, and import/export.
New Features
Below is a list of some of these new features in version 5:
- Licenses can be perpetual or subscription based.
- Subscriptions can be annual, monthly, or weekly.
- Subscriptions can be manually or automatically renewed.
- Licenses can be purchased and registered in GaeaSynergy or the GaeaSynergy Network Monitor.
- After purchase, licenses can be immediately added and used in GaeaSynergy.
- Annual maintenance can be purchased and renewed as a subscription.
- Industries no longer apply to the WinLoG and WinFence modules. These modules now have the features of all the industries.
- Projects can be archived and retrieved from archives. This allows for the easier selection of current projects.
- Cross-sections can be created manually instead of using the project map by specifying the distances between the boreholes/wells.
- Instead of specifying depths they can also be picked on the borehole/well logs for lithology, text, text interval, USCS, and formation tops columns.
- A USCS calculator can be used to determine the USCS classification in USCS and lithology columns in borehole/well logs.
- Borehole data can be exported and imported to and from DIGGS (Data Interchange for Geotechnical and Geoenvironmental Specialists) files.
- New and improved exporting and importing of borehole data to gINT.
- New and improved exporting and importing of borehole data to AGS.
- Munsell colors can be specified for lithologies and samples.
- In georeferenced projects a topographic map can automatically be created using elevations from Google.
- When creating a new borehole/well in a georeferenced project the elevation is automatically entered using Google elevations.
- Continuous well logs can be exported to a PDF file as a continuous page.
- Divider lines in lithologic columns of borehole/well logs can be extended to better show contact depths when descriptions are pushed down.
License Management
- Controls optional module licenses
- Support for either stand-alone or network licensing
User Management
- Users are assigned a username, password, and privilege level
- Users can be local or network users
- Different privilege levels are used to control access to progran functions and data
- Privilege levels are administrator, power user, limited user, and guest
Database Management
- Used to store, track, and retrieve all the data in the application.
- Automatic backup of databases.
- Projects can be archived and retrieved from archives. This allows for the easier selection of current projects.
- Projects can have a password assigned.
- Access rights to data can be restricted to specific personnel or by user privilege level.
- An audit trail of all database changes can be created.
Import/Export
- Projects can be exported and imported in Access and XML format
- Older WinLoG, WinFence, and WinSieve data can be imported
- AGS, gINT, and DIGGS data can be imported and exported
- Boring and well data can be imported and exported to and from gINT version 8 project databases
- Ontario and Michigan government water well data can be imported
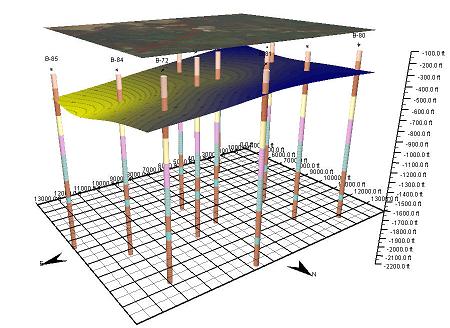
3D Display
All of the samples, wells and borings, cross-sections, contour maps, layers, GIS data, buildings, structures, and excavations entered in a project can be displayed in 3D. Below are some of the features of the 3D display component:
- 3D display can be used to show and manipulate objects in 3 dimensions
- Industry standard OpenGL is used to generate the display
- Displays can be panned and zoomed and contain a light source that can be moved
- The display of samples, wells, borings, cross-sections, contour maps, and solids can be turned off and on
- GIS data from the project map can be overlain
- Lab analyses and geotechnical test results can be displayed above samples
- Contour maps can be displayed as a flat surface or draped at the elevation of the grid nodes
- Solids are automatically generated from strata that have their top and bottoms defined by contour maps
- Cutouts can be used to selectively remove portions of solids
- The transparency of contour maps and project GIS overlays
Geographic Information System
This component provides the geographic information system (GIS) for the GaeaSynergy application. It is used as the primary display and selection interface for the application and is fully integrated with the optional modules. There are two types of basemaps, web map services or static. The GIS stores all of the basemap, project, well, boring, cross-section, and other spatial data for the application. GIS layers can include satellite images, aerial photos, roads and streets, pipelines, railway lines, flood zones, municipal zoning, terrain, topography, and demographic data.
Web Map Services
Web map services use a standard protocol to serve georeferenced map images over the Internet. This protocol was developed and published by the Open Geospatial Consortium. Several web map services are available within the application and more are being added with each update.
Static Basemaps
These basemaps consist of a set of georeferenced layers (shape files) for different parts of the world.
Features
Below are some of the features of the GIS component:
- Web map services include Bing Aerial, Bing Roads, Open Street Maps, MapQuest Open Street Maps, MapQuest Open Aerial, USGS Orthoimagery, USGS Elevation, USGS Geology, Canada Atlas, British Bedrock and Geology, British Hydrogeology, European Altitude, European Soil Classification, and Australian Geology.
- Over 300 predefined static basemaps that cover most countries can be downloaded from Internet.
- Custom web map services can be added within the program.
- Projects, well and boring locations, cross-section locations and other spatial can be displayed on a basemap.
- Basemaps represent the geographic data as a collection of layers.
- Examples of layers are satellite images, aerial photos, roads, lakes and streams, political boundaries, building footprints, utility lines, and terrain.
- Project, well, and boring data can be spatially queried, selected, and reported from the basemap.
- GIS data from the project map can be overlain on 3D displays.
Structures
This component of GaeaSynergy is used to create simplified buildings,
structures, and excavations for display in 3D. After they have been created
these buildings and excavations can be used to show the positions of these
structures in 3D relative to samples, borings, wells, cross-sections,
contour maps, and solids.
The following buildings, structures, and excavations can be created:
- rectangular shaped buildings
- irregular shaped buildings
- storage tanks
- silos
- storage piles
- underground shafts
- excavations
Buildings and excavations can be selected and scaled or rotated. Multiple buildings and excavations can also be selected and aligned. Once the position and size of the building or excavation is correct, the size and position can be locked on to the project map.
Features
Below are some of the features of the structures component:
- Multiple buildings, structures, and excavations can be added to a project.
- Base elevation, height, slope, tilt angle, tilt direction, position, boundary points, labels, and colors can be entered.
- The base elevation, slope, height, tilt angle, tile direction, position, and boundary points can be edited.
- Buildings, structures and excavations can be selected and scaled or rotated.
- Multiple buildings, structures, and excavations can be selected and aligned.
- Position and size can be locked and unlocked.
- Project map can be overlain on to view for the creation of the buildings, structures, and excavations.
- Buildings, structures, and excavations view can be zoomed and panned.
- Grid can be overlain on to view and buildings, structures, and excavations can be snapped to grid.
Mapping and Gridding
This component of GaeaSynergy can grid and contour many types of data from borings, wells, cross-sections, samples, lab analyses and geotechnical test results. After the data has been entered in the optional modules, it can be automatically extracted and used to generate contour maps.
The data can be gridded with 6 different common gridding algorithms. The grids can cover the entire map area or be constrained to a polygonal area. Individual grid nodes can be subsequently edited. Areas of grids can be blanked to represent zones of no data. Several types of mathematical operations can be performed on one or more grids.
After the contour map has been created, it can be overlain on top of the project map. In addition, the contour map and any solids constructed from the top and bottom contours of strata can be displayed in 3D.
Features
Below are some of the features of the mapping and gridding component:
- Diverse types of data can be shifted and merged.
- Points in datasets can be edited and stored separately from the derived points from the optional modules.
- Statistics can be calculated on datasets.
- Mathematical operations such as unit conversion; add, subtract, divide, and multiple by a constant; minimum and maximum limits; raise to a power; logarithm; and square root can be applied to a dataset.
- Two datasets can be added, subtracted, multiplied or divided.
- High and low pass filters can be applied to a dataset.Data can be gridded using Natural Neighbor, Inverse Distance, Modified Sheppard, Minimum Curvature, Trend Surface, and Nearest Neighbor.
- Grid intervals can be entered, estimated, or copied from another grid.
- Grids can either cover the entire project area or a polygonal subset of the area.
- Areas of grids can be blanked to represent zones of no data.
- Mathematical operations can be performed on one or more grids,
- Individual grid node values can be edited.
- Contour maps can be drawn with contour lines, color fill, or colored contour lines.
- Contour intervals can be entered or estimated.
- Individual contour levels can be edited for greater control.
- Labels on contour lines can be easily moved and deleted.
![]()
Tutorial Videos
 Introduction
and Product Overview
Introduction
and Product Overview
Installation,
Setup
and Registration
Network
Setup
Scheduling
and Tasks
Projects
Stations
Samples
User's Guide and Brochure
![]()

Products
Services
Resources
Other
© Copyright 2023: GAEA Technologies Ltd.